Creates timeline (Gantt-style) charts for visualizing events over time. Used in project management, clinical history, and historical timelines.
Usage
TimelinePlot(
  data,
  start,
  end = NULL,
  label = NULL,
  group_by = NULL,
  group_by_sep = "_",
  group_name = NULL,
  bar_height = 0.6,
  pt_size = 4,
  label_size = 3.5,
  label_position = c("inside", "above", "below"),
  split_by = NULL,
  split_by_sep = "_",
  facet_by = NULL,
  facet_scales = "free_y",
  facet_nrow = NULL,
  facet_ncol = NULL,
  facet_byrow = TRUE,
  theme = "theme_ggforge",
  theme_args = list(),
  palette = "forge",
  palcolor = NULL,
  alpha = 0.85,
  legend.position = "right",
  legend.direction = "vertical",
  title = NULL,
  subtitle = NULL,
  xlab = NULL,
  ylab = NULL,
  seed = 8525,
  combine = TRUE,
  nrow = NULL,
  ncol = NULL,
  byrow = TRUE,
  axes = NULL,
  axis_titles = NULL,
  guides = NULL,
  design = NULL,
  ...
)
Arguments
- data
A data frame containing the data to plot
- start
Column for event start time/date.
- end
Column for event end time/date. If NULL, events are point events.
- label
Column for event labels.
- group_by
Column for grouping (track/row assignment).
- group_by_sep
Separator for multiple group_by columns.
- group_name
Legend title.
- bar_height
Height of event bars (0-1).
- pt_size
Size for point events (when end is NULL).
- label_size
Size of event labels.
- label_position
Label position: "inside", "above", "below".
- split_by
Column name(s) to split data into multiple plots
- split_by_sep
Separator when concatenating multiple split_by columns
- facet_by
Column name(s) for faceting the plot
- facet_scales
Scales for facets: "fixed", "free", "free_x", "free_y"
- facet_nrow
Number of rows in facet layout
- facet_ncol
Number of columns in facet layout
- facet_byrow
Fill facets by row (TRUE) or column (FALSE)
- theme
Theme name (string) or theme function
- theme_args
List of arguments passed to theme function
- palette
Color palette name
- palcolor
Custom colors for palette
- alpha
Transparency level (0-1)
- legend.position
Legend position: "none", "left", "right", "bottom", "top"
- legend.direction
Legend direction: "horizontal" or "vertical"
- title
Plot title
- subtitle
Plot subtitle
- xlab
X-axis label
- ylab
Y-axis label
- seed
Random seed for reproducibility
- combine
Whether to combine split plots into one
- nrow
Number of rows when combining plots
- ncol
Number of columns when combining plots
- byrow
Fill combined plots by row
- axes
How to handle axes in combined plots ("keep", "collect", "collect_x", "collect_y")
- axis_titles
How to handle axis titles in combined plots
- guides
How to handle guides in combined plots ("collect", "keep", "auto")
- design
Custom layout design for combined plots
- ...
Additional arguments passed to atomic plotting functions.
Examples
# \donttest{
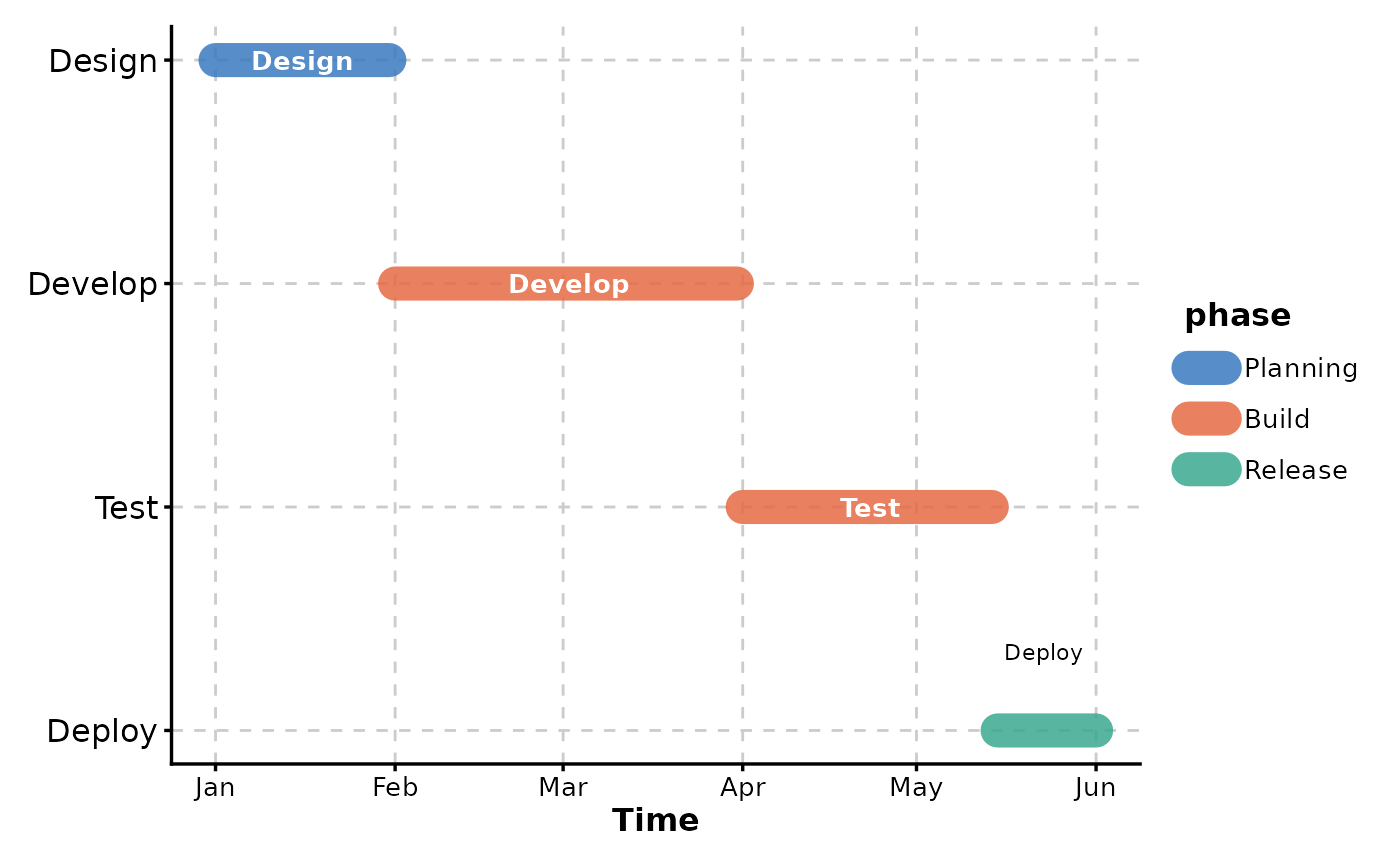
events <- data.frame(
task = c("Design", "Develop", "Test", "Deploy"),
start = as.Date(c("2024-01-01", "2024-02-01", "2024-04-01", "2024-05-15")),
end = as.Date(c("2024-01-31", "2024-03-31", "2024-05-14", "2024-06-01")),
phase = c("Planning", "Build", "Build", "Release")
)
TimelinePlot(events, start = "start", end = "end",
label = "task", group_by = "phase")
 # }
# }