Creates waffle (square pie) charts for proportional data visualization. An alternative to pie charts that uses a grid of squares.
Usage
WafflePlot(
  data,
  x,
  y = NULL,
  n_total = 100,
  n_rows = 10,
  flip = FALSE,
  group_name = NULL,
  split_by = NULL,
  split_by_sep = "_",
  theme = "theme_ggforge",
  theme_args = list(),
  palette = "forge",
  palcolor = NULL,
  alpha = 1,
  legend.position = "right",
  legend.direction = "vertical",
  title = NULL,
  subtitle = NULL,
  seed = 8525,
  combine = TRUE,
  nrow = NULL,
  ncol = NULL,
  byrow = TRUE,
  axes = NULL,
  axis_titles = NULL,
  guides = NULL,
  design = NULL,
  ...
)
Arguments
- data
A data frame containing the data to plot
- x
Column for categories.
- y
Column for values. If NULL, uses counts of x.
- n_total
Total number of squares in the waffle grid.
- n_rows
Number of rows in the waffle grid.
- flip
Whether to flip the waffle orientation.
- group_name
Legend title.
- split_by
Column name(s) to split data into multiple plots
- split_by_sep
Separator when concatenating multiple split_by columns
- theme
Theme name (string) or theme function
- theme_args
List of arguments passed to theme function
- palette
Color palette name
- palcolor
Custom colors for palette
- alpha
Transparency level (0-1)
- legend.position
Legend position: "none", "left", "right", "bottom", "top"
- legend.direction
Legend direction: "horizontal" or "vertical"
- title
Plot title
- subtitle
Plot subtitle
- seed
Random seed for reproducibility
- combine
Whether to combine split plots into one
- nrow
Number of rows when combining plots
- ncol
Number of columns when combining plots
- byrow
Fill combined plots by row
- axes
How to handle axes in combined plots ("keep", "collect", "collect_x", "collect_y")
- axis_titles
How to handle axis titles in combined plots
- guides
How to handle guides in combined plots ("collect", "keep", "auto")
- design
Custom layout design for combined plots
- ...
Additional arguments passed to atomic plotting functions.
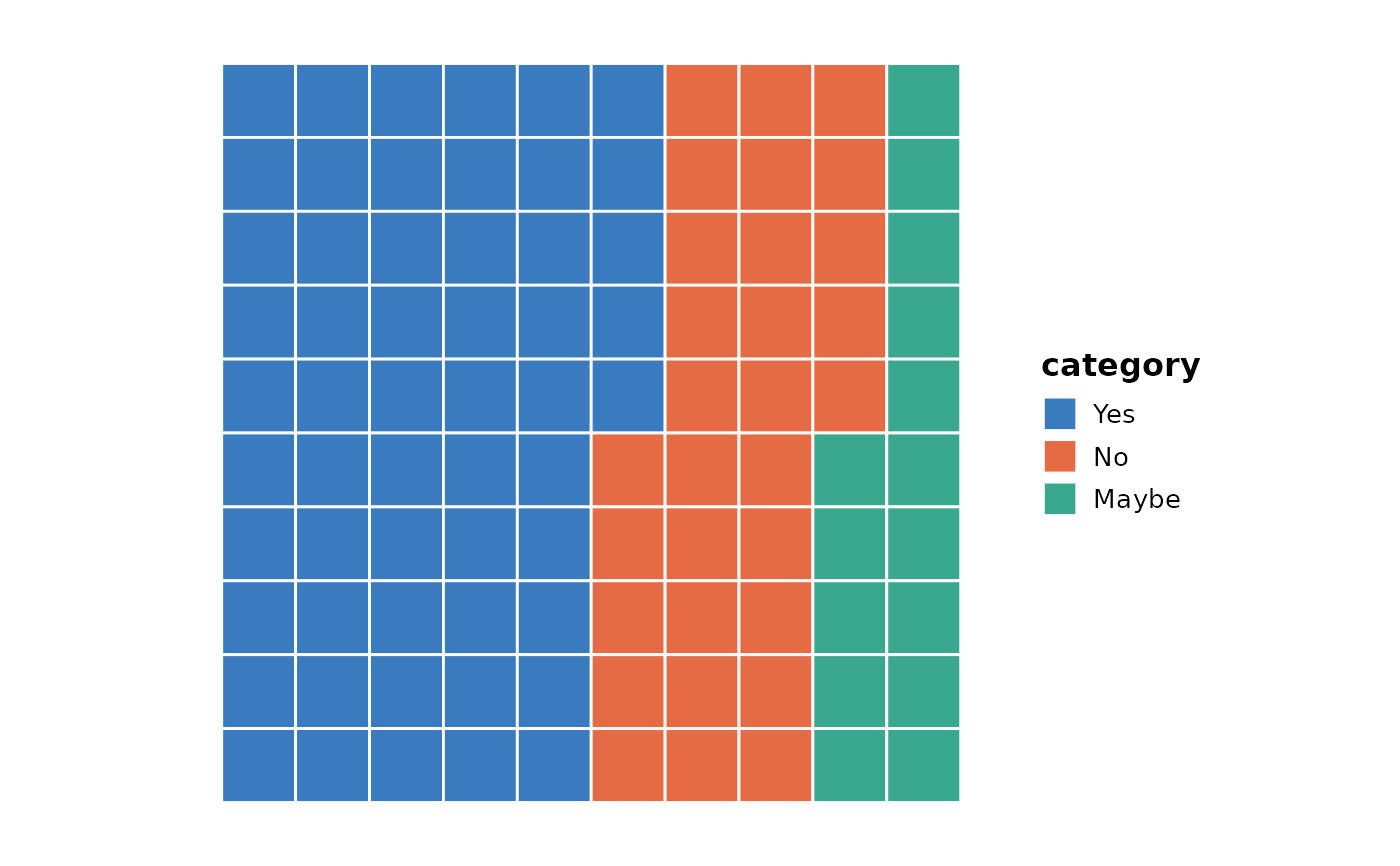
Examples
# \donttest{
data <- data.frame(
  category = c("Yes", "No", "Maybe"),
  count = c(55, 30, 15)
)
WafflePlot(data, x = "category", y = "count")

# }
# }