Creates dumbbell (Cleveland dot) plots showing paired values connected by a line. Ideal for before/after comparisons, differences between groups, or showing ranges. Common in economics, medicine, education, and policy analysis.
Usage
DumbbellPlot(
  data,
  x_start,
  x_end,
  y,
  y_sep = "_",
  sort_y = c("none", "asc", "desc"),
  segment_color = "grey60",
  segment_width = 1.5,
  start_color = NULL,
  end_color = NULL,
  pt_size = 3.5,
  start_name = NULL,
  end_name = NULL,
  split_by = NULL,
  split_by_sep = "_",
  facet_by = NULL,
  facet_scales = "fixed",
  facet_nrow = NULL,
  facet_ncol = NULL,
  facet_byrow = TRUE,
  theme = "theme_ggforge",
  theme_args = list(),
  palette = "forge",
  palcolor = NULL,
  alpha = 1,
  aspect.ratio = NULL,
  legend.position = "top",
  legend.direction = "horizontal",
  title = NULL,
  subtitle = NULL,
  xlab = NULL,
  ylab = NULL,
  seed = 8525,
  combine = TRUE,
  nrow = NULL,
  ncol = NULL,
  byrow = TRUE,
  axes = NULL,
  axis_titles = NULL,
  guides = NULL,
  design = NULL,
  ...
)
Arguments
- data
A data frame containing the data to plot
- x_start
Column for the start (left) value.
- x_end
Column for the end (right) value.
- y
Column for category labels.
- y_sep
Separator for multiple y columns.
- sort_y
How to sort y: "none", "asc" (by difference), "desc".
- segment_color
Color of connecting line.
- segment_width
Width of connecting line.
- start_color
Color for start points.
- end_color
Color for end points.
- pt_size
Point size.
- start_name
Legend label for start points.
- end_name
Legend label for end points.
- split_by
Column name(s) to split data into multiple plots
- split_by_sep
Separator when concatenating multiple split_by columns
- facet_by
Column name(s) for faceting the plot
- facet_scales
Scales for facets: "fixed", "free", "free_x", "free_y"
- facet_nrow
Number of rows in facet layout
- facet_ncol
Number of columns in facet layout
- facet_byrow
Fill facets by row (TRUE) or column (FALSE)
- theme
Theme name (string) or theme function
- theme_args
List of arguments passed to theme function
- palette
Color palette name
- palcolor
Custom colors for palette
- alpha
Transparency level (0-1)
- aspect.ratio
Aspect ratio of plot panel
- legend.position
Legend position: "none", "left", "right", "bottom", "top"
- legend.direction
Legend direction: "horizontal" or "vertical"
- title
Plot title
- subtitle
Plot subtitle
- xlab
X-axis label
- ylab
Y-axis label
- seed
Random seed for reproducibility
- combine
Whether to combine split plots into one
- nrow
Number of rows when combining plots
- ncol
Number of columns when combining plots
- byrow
Fill combined plots by row
- axes
How to handle axes in combined plots ("keep", "collect", "collect_x", "collect_y")
- axis_titles
How to handle axis titles in combined plots
- guides
How to handle guides in combined plots ("collect", "keep", "auto")
- design
Custom layout design for combined plots
- ...
Additional arguments passed to atomic plotting functions.
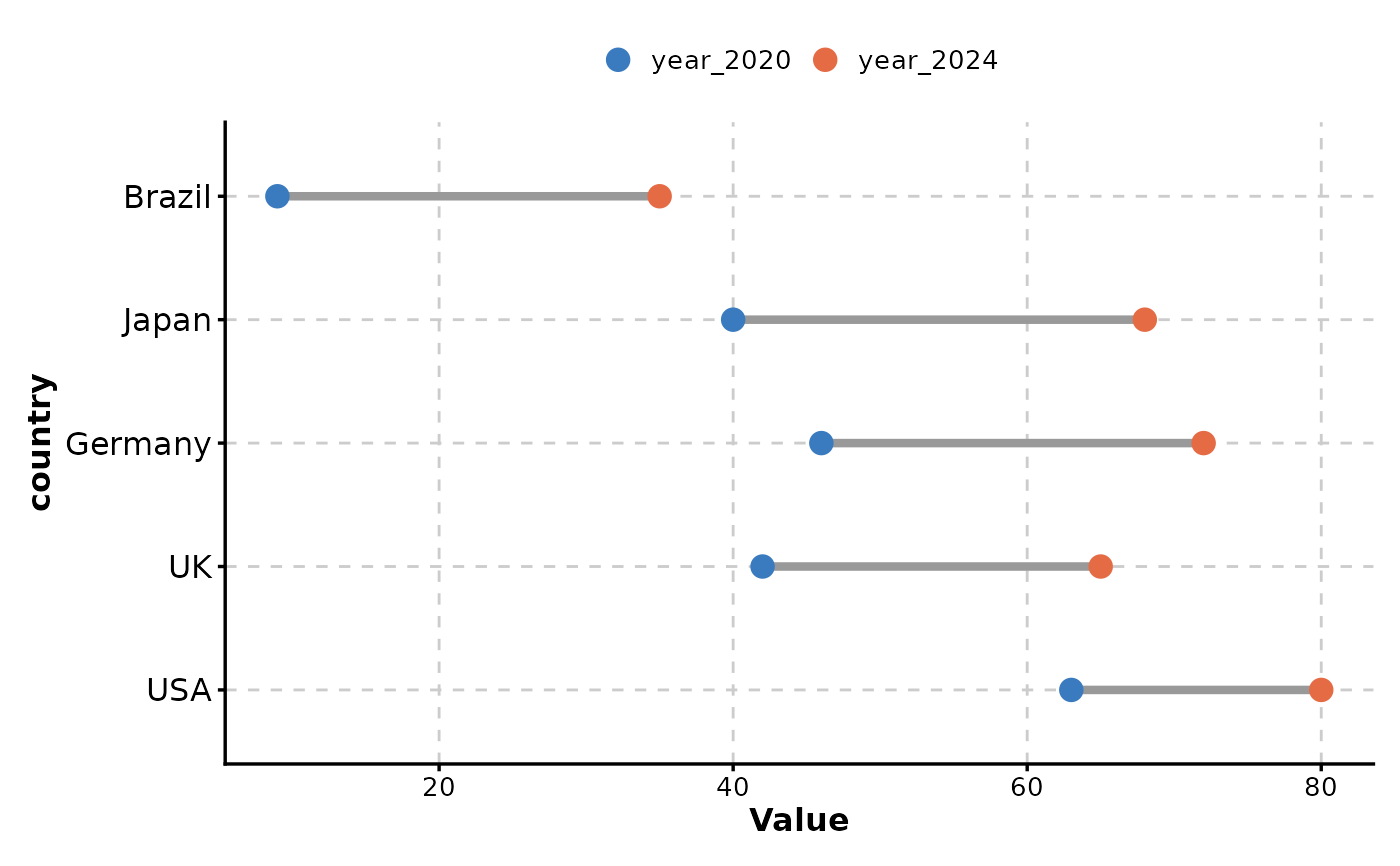
Examples
# \donttest{
data <- data.frame(
  country = c("USA", "UK", "Germany", "Japan", "Brazil"),
  year_2020 = c(63, 42, 46, 40, 9),
  year_2024 = c(80, 65, 72, 68, 35)
)
DumbbellPlot(data, x_start = "year_2020", x_end = "year_2024", y = "country")

# }
# }