Jittered point plot with optional background, highlight, labels and faceting. Supports point sizing, dodge grouping, and various customization options.
Usage
JitterPlot(
  data,
  x,
  x_sep = "_",
  y = NULL,
  in_form = c("long", "wide"),
  split_by = NULL,
  split_by_sep = "_",
  sort_x = NULL,
  flip = FALSE,
  keep_empty = FALSE,
  group_by = NULL,
  group_by_sep = "_",
  group_name = NULL,
  x_text_angle = 0,
  order_by = "-({y}^2 + {size_by}^2)",
  theme = "theme_ggforge",
  theme_args = list(),
  palette = "forge",
  palcolor = NULL,
  alpha = 1,
  aspect.ratio = NULL,
  legend.position = "right",
  legend.direction = "vertical",
  shape = 21,
  border = "black",
  size_by = 2,
  size_name = NULL,
  size_trans = NULL,
  y_nbreaks = 4,
  jitter_width = 0.5,
  jitter_height = 0,
  y_max = NULL,
  y_min = NULL,
  y_trans = "identity",
  add_bg = FALSE,
  bg_palette = "stripe",
  bg_palcolor = NULL,
  bg_alpha = 0.2,
  add_hline = NULL,
  hline_type = "solid",
  hline_width = 0.5,
  hline_color = "black",
  hline_alpha = 1,
  labels = NULL,
  label_by = NULL,
  nlabel = 5,
  label_size = 3,
  label_fg = "black",
  label_bg = "white",
  label_bg_r = 0.1,
  highlight = NULL,
  highlight_color = "red2",
  highlight_size = 1,
  highlight_alpha = 1,
  facet_by = NULL,
  facet_scales = "fixed",
  facet_ncol = NULL,
  facet_nrow = NULL,
  facet_byrow = TRUE,
  title = NULL,
  subtitle = NULL,
  xlab = NULL,
  ylab = NULL,
  seed = 8525,
  combine = TRUE,
  nrow = NULL,
  ncol = NULL,
  byrow = TRUE,
  axes = NULL,
  axis_titles = axes,
  guides = NULL,
  design = NULL,
  ...
)
Arguments
- data
A data frame containing the data to plot
- x
A character string of the column name to plot on the x-axis. A character/factor column is expected. If multiple columns are provided, the columns will be concatenated with
x_sep.- x_sep
A character string to concatenate the columns in
x, if multiple columns are provided. Whenin_formis "wide",xcolumns will not be concatenated.- y
A character string of the column name to plot on the y-axis. A numeric column is expected. When
in_formis "wide",yis not required. The values underxcolumns will be used as y-values.- in_form
A character string to specify the input data type. Either "long" or "wide".
- split_by
Column name(s) to split data into multiple plots
- split_by_sep
Separator when concatenating multiple split_by columns
- sort_x
Expression string to sort x-axis values, or NULL for no sorting. Legacy values supported: "none", "mean_asc", "mean_desc", "mean", "median_asc", "median_desc", "median". Custom expressions like
"sd(y)"or"max(y) - min(y)"are also accepted.meanis an alias formean_asc.median_ascsorts the x-axis by ascending median of y-values.median_descsorts the x-axis by descending median of y-values.medianis an alias formedian_asc.
- flip
A logical value to flip the plot.
- keep_empty
A logical value to keep the empty levels in the x-axis.
- group_by
A character string to dodge the points.
- group_by_sep
A character string to concatenate the columns in
group_by, if multiple columns are provided.- group_name
A character string to name the legend of dodge.
- x_text_angle
Angle for x-axis text labels
- order_by
A string of expression passed to
dplyr::arrange()to order the data to get the topnlabelpoints for labeling. Default is-({y}^2 + {size_by}^2)(similar to VolcanoPlot).- theme
Theme name (string) or theme function
- theme_args
List of arguments passed to theme function
- palette
Color palette name
- palcolor
Custom colors for palette
- alpha
Transparency level (0-1)
- aspect.ratio
Aspect ratio of plot panel
- legend.position
Legend position: "none", "left", "right", "bottom", "top"
- legend.direction
Legend direction: "horizontal" or "vertical"
- shape
A numeric value to specify the point shape. Shapes 21–25 have borders; border behavior is controlled by
border.- border
A logical or character value to specify the border of points when the shape has border (21–25). If TRUE, border color follows the point color (same as fill). If a color string, uses that constant border color. If FALSE, no border.
- size_by
A numeric column name or a single numeric value for the point size. When a column, sizes are scaled (see scatter plots).
- size_name
Legend title for size when
size_byis a column.- size_trans
A function or a name of a global function to transform
size_by(whensize_byis a column). The legend shows original (untransformed) values.- jitter_width
Width of jitter.
- jitter_height
Height of jitter.
- y_max, y_min
Numeric or quantile strings ("q95", "q5") for y limits computation (used for fixed coord).
- y_trans, y_nbreaks
Axis settings.
- add_bg
A logical value to add background to the plot.
- bg_palette
A character string to specify the palette of the background.
- bg_palcolor
A character vector to specify the colors of the background.
- bg_alpha
A numeric value to specify the transparency of the background.
- add_hline
Add one or more horizontal reference lines at the given y-value(s).
- hline_type
The line type for the horizontal reference line(s).
- hline_width
The line width for the horizontal reference line(s).
- hline_color
The color for the horizontal reference line(s).
- hline_alpha
The alpha for the horizontal reference line(s).
- labels
A vector of row names or indices to label the points.
- label_by
A character column name to use as the label text. If NULL, rownames are used.
- nlabel
Number of points to label per x-group when
labelsis NULL (top by y^2 + size^2).- label_size, label_fg, label_bg, label_bg_r
Label aesthetics.
- highlight, highlight_color, highlight_size, highlight_alpha
Highlighted point options.
- facet_by
Column name(s) for faceting the plot
- facet_scales
Scales for facets: "fixed", "free", "free_x", "free_y"
- facet_ncol
Number of columns in facet layout
- facet_nrow
Number of rows in facet layout
- facet_byrow
Fill facets by row (TRUE) or column (FALSE)
- title
Plot title
- subtitle
Plot subtitle
- xlab
X-axis label
- ylab
Y-axis label
- seed
Random seed for reproducibility
- combine
Whether to combine split plots into one
- nrow
Number of rows when combining plots
- ncol
Number of columns when combining plots
- byrow
Fill combined plots by row
- axes
How to handle axes in combined plots ("keep", "collect", "collect_x", "collect_y")
- axis_titles
How to handle axis titles in combined plots
- guides
How to handle guides in combined plots ("collect", "keep", "auto")
- design
Custom layout design for combined plots
- ...
Additional arguments passed to atomic plotting functions.
Value
The Jitter plot(s).
When split_by is not provided, it returns a ggplot object.
When split_by is provided, it returns a object of plots wrapped by patchwork::wrap_plots if combine = TRUE;
otherwise, it returns a list of ggplot objects.
Examples
# \donttest{
set.seed(8525)
n <- 200
x <- sample(LETTERS[1:5], n, replace = TRUE)
group <- sample(c("G1", "G2"), n, replace = TRUE)
size <- rexp(n, rate = 1)
id <- paste0("pt", seq_len(n))
y <- rnorm(n, mean = ifelse(group == "G1", 0.5, -0.5)) +
as.numeric(factor(x, levels = LETTERS[1:5])) / 10
df <- data.frame(
x = factor(x, levels = LETTERS[1:5]),
y = y,
group = group,
size = size,
id = id
)
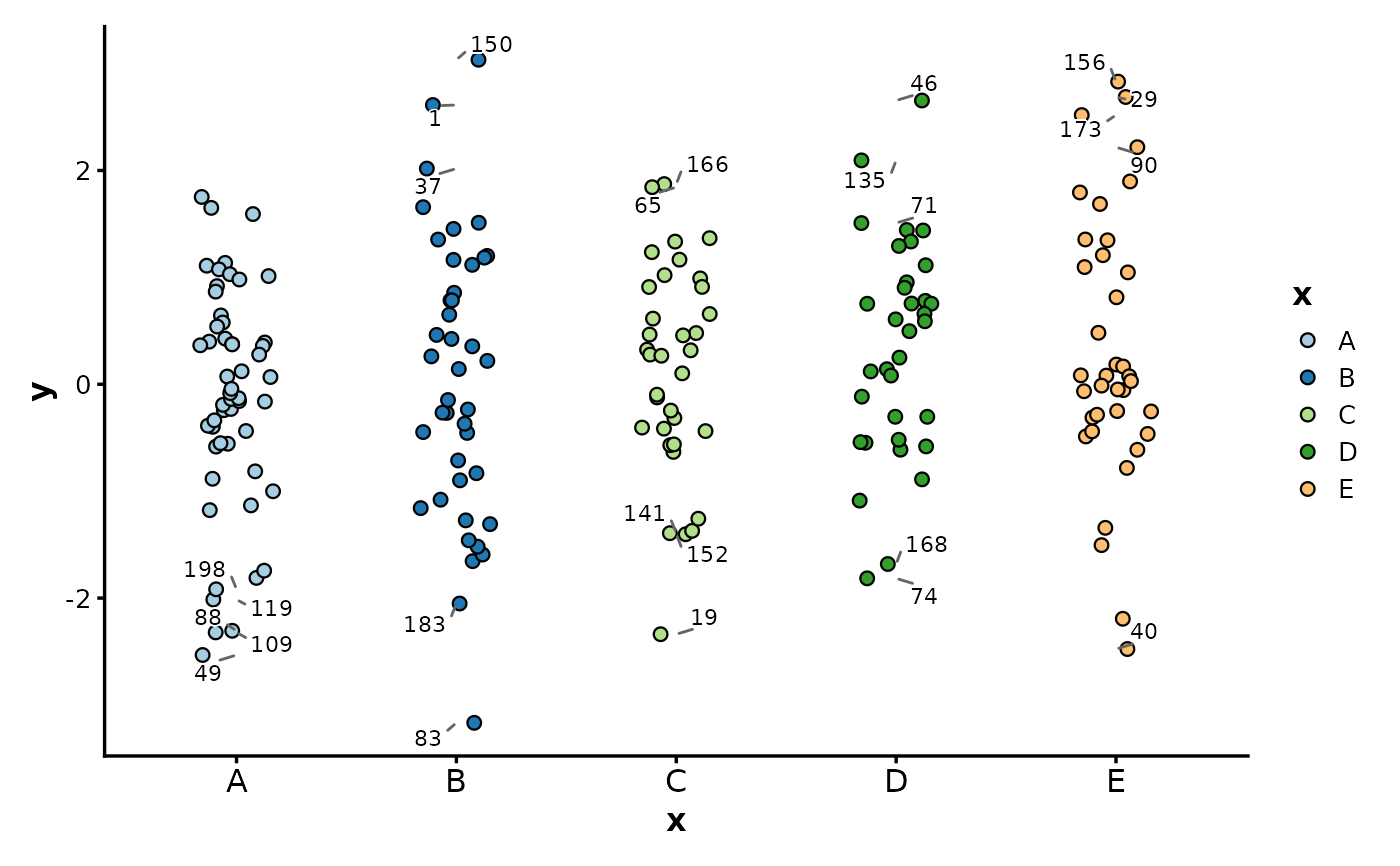
# Basic
JitterPlot(df, x = "x", y = "y")
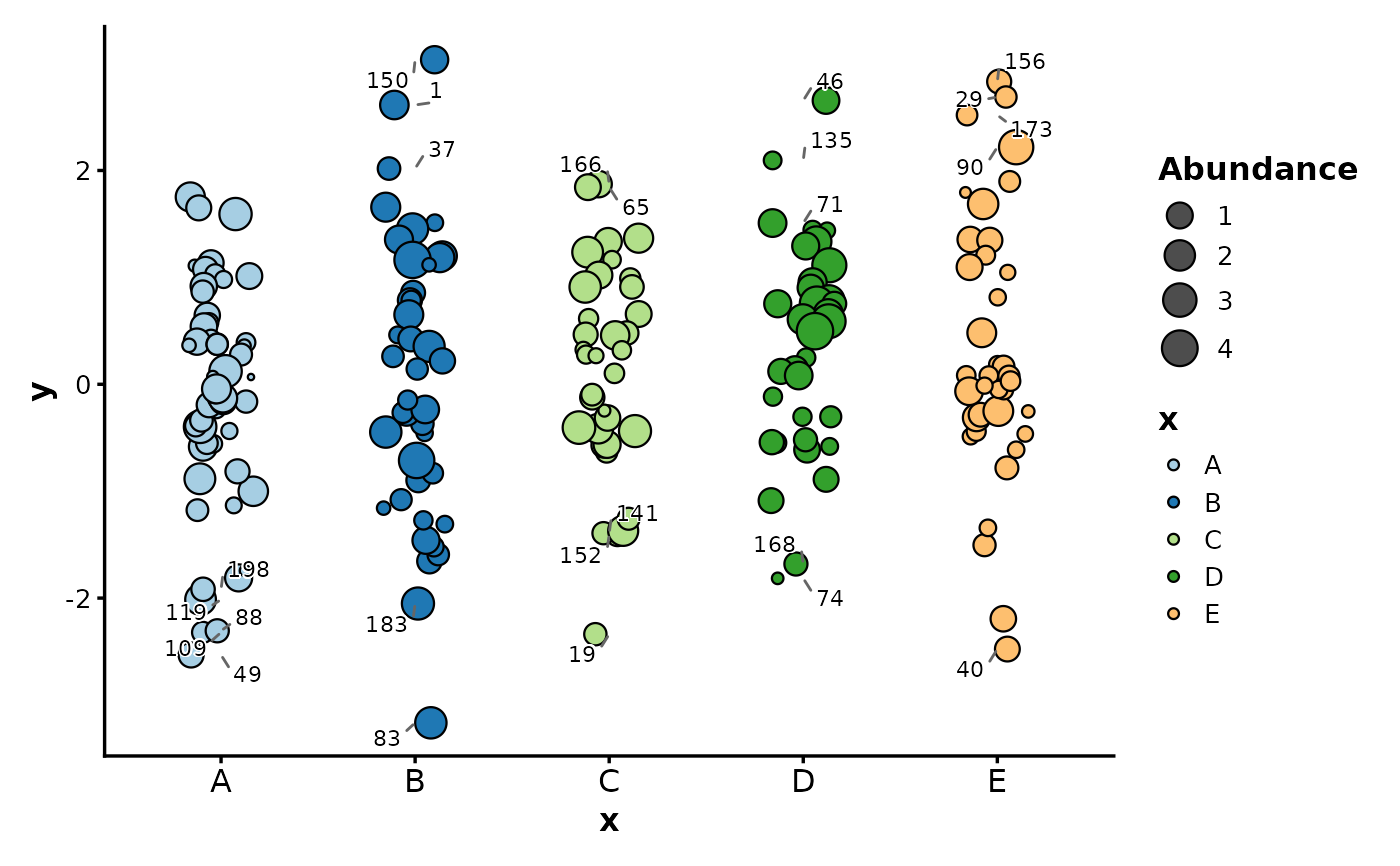
 # Map size with transform; legend shows original values
JitterPlot(df,
x = "x", y = "y", size_by = "size", size_name = "Abundance",
size_trans = sqrt, order_by = "-y^2"
)
# Map size with transform; legend shows original values
JitterPlot(df,
x = "x", y = "y", size_by = "size", size_name = "Abundance",
size_trans = sqrt, order_by = "-y^2"
)
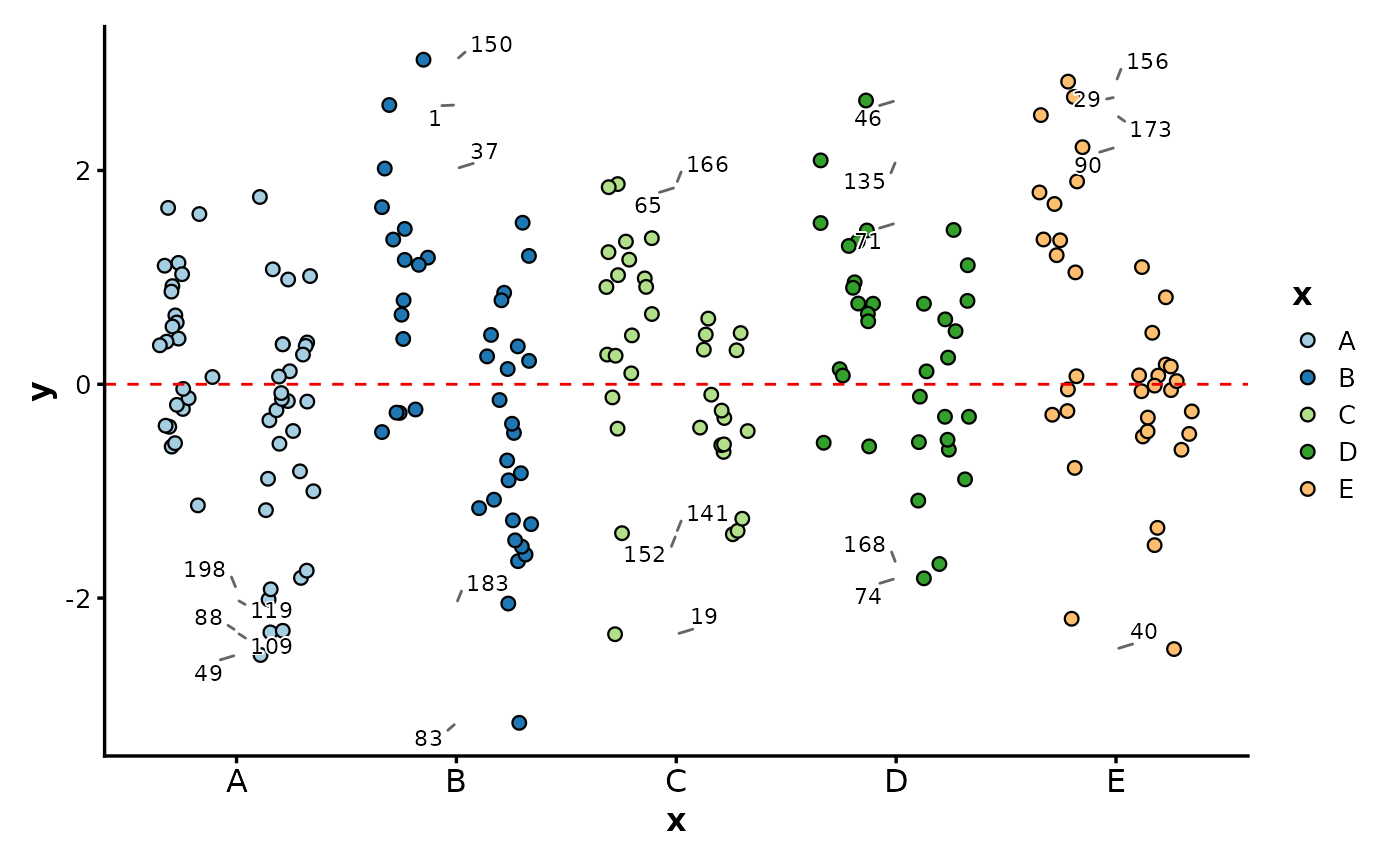
 # Dodge by group and add a horizontal line
JitterPlot(df,
x = "x", y = "y", group_by = "group",
add_hline = 0, hline_type = "dashed", hline_color = "red2"
)
# Dodge by group and add a horizontal line
JitterPlot(df,
x = "x", y = "y", group_by = "group",
add_hline = 0, hline_type = "dashed", hline_color = "red2"
)
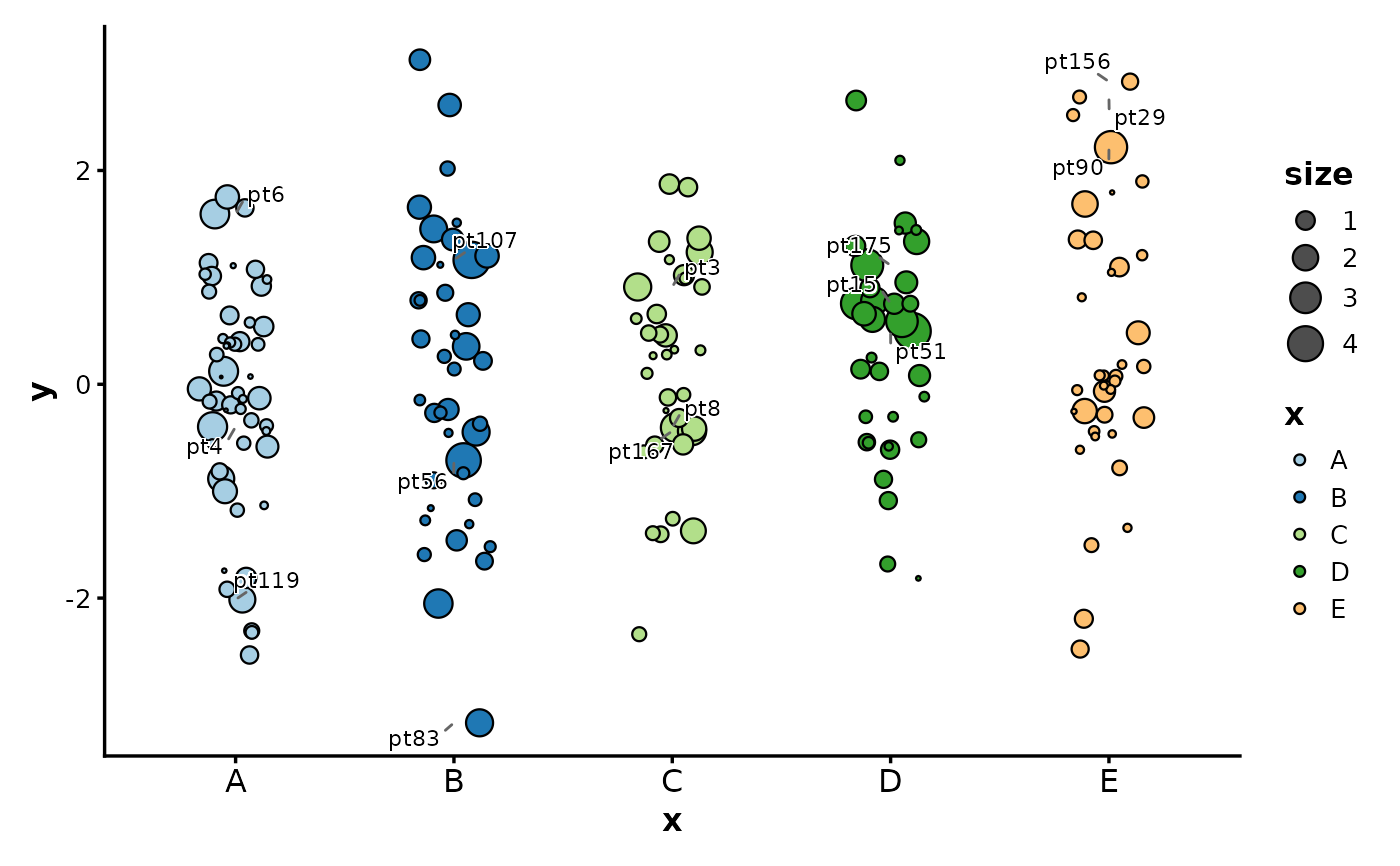
 # Label top points by distance (y^2 + size^2)
JitterPlot(df, x = "x", y = "y", size_by = "size", label_by = "id", nlabel = 3)
# Label top points by distance (y^2 + size^2)
JitterPlot(df, x = "x", y = "y", size_by = "size", label_by = "id", nlabel = 3)
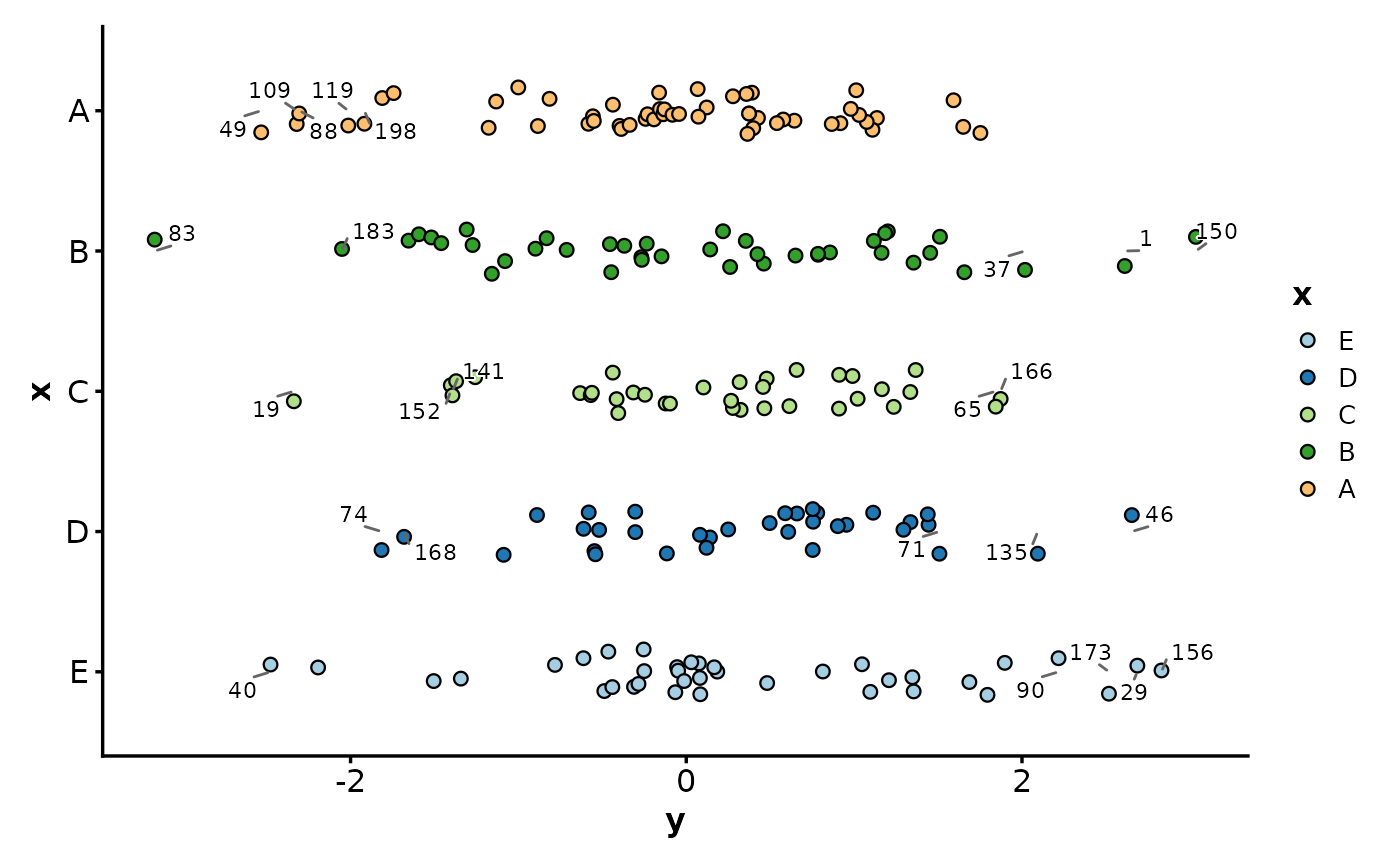
 # Flip axes
JitterPlot(df, x = "x", y = "y", flip = TRUE)
# Flip axes
JitterPlot(df, x = "x", y = "y", flip = TRUE)
 # }
# }